Buyers approaching Manhattan Beach with a mortgage pre-approval in hand tend to sort the city into a familiar hierarchy. The Strand and Sand Section are for cash and connections. The Hill Section is for buyers chasing a view who can absorb whatever a large, sometimes irregular lot commands. Tree Section is where the rest of the market lives, the walkable, family-oriented middle ground where a financed offer still has a fighting chance.
That last assumption is the one worth checking before you write an offer. Sales data for the first four months of 2026 shows Tree Section carrying the highest concentration of all-cash purchases of any section in the city, ahead of Sand, ahead of Hill, ahead of the citywide average. A buyer who chose Tree Section specifically because it seemed like the section where financing wouldn't be a disadvantage picked, statistically, the section where it is.
The Section Everyone Assumes Is the On-Ramp
The reasoning behind that assumption is not unreasonable. Sand Section lots are famously narrow, often 30 to 35 feet wide, which is part of why the section consistently prices at the top of the city on a per square foot basis through 2026. Land is scarce, homes sit close to the water, and buyers pay for both. Hill Section sits on the opposite end of the lot-size spectrum. Local zoning allows house sizes up to roughly 15,000 square feet there, well above what Tree Section permits, which is a major reason Hill routinely produces the highest total sale prices in the city even when its price per square foot trails Sand's. Bigger lots, bigger homes, bigger checks, even if the rate per square foot doesn't top the chart.
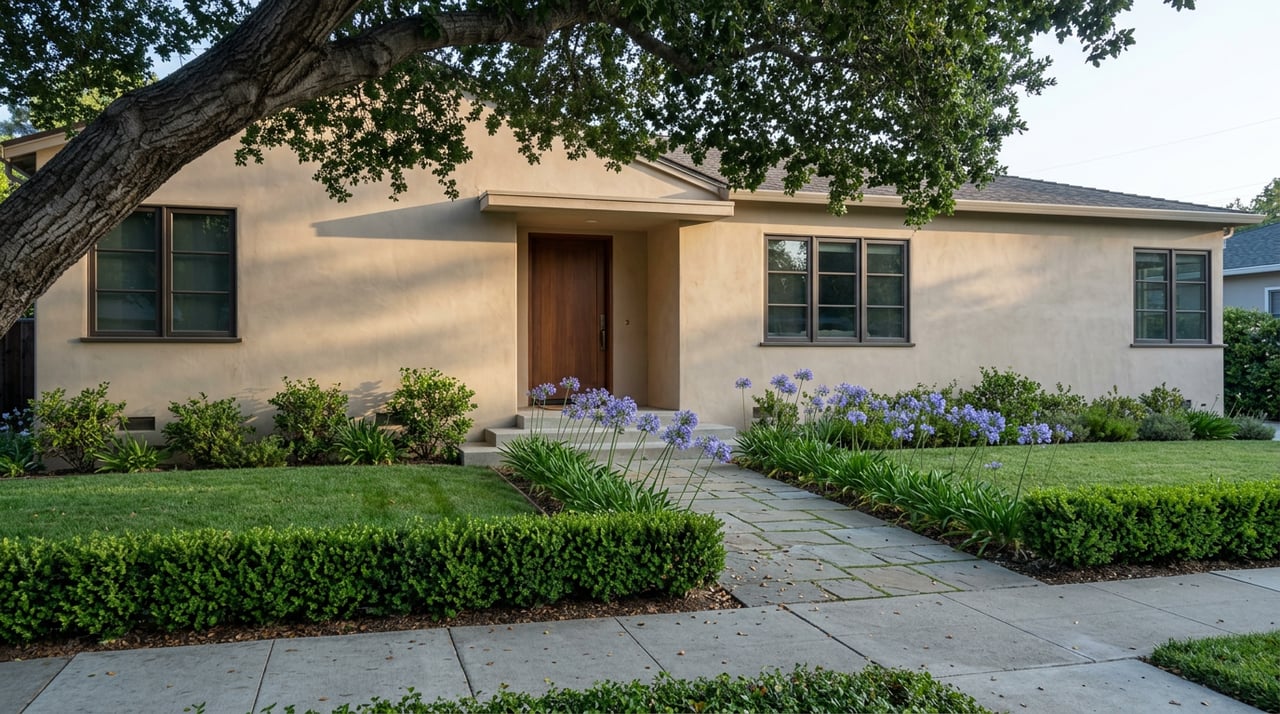
Tree Section, capped closer to 10,800 square feet under the city's building rules, lands in between on both measures. It's genuinely more moderate than Sand or Hill on price per square foot, and its homes trade for less in total than the typical Hill Section sale. The tree-lined streets east of Sepulveda, Oak, Laurel, Poinsettia, Elm, Magnolia, and Pine among them, feed into Mira Costa High School and sit within walking distance of the Village. On paper, it reads as the section built for a buyer who wants Manhattan Beach without competing at Strand or Hill money.
That framing holds up on price. It falls apart on financing.
What the First Four Months of 2026 Actually Showed
Manhattan Beach closed $491.2 million in home sales between January and April 2026, a 7.5 percent increase over the same period in 2025, on a nearly identical number of transactions, 114 versus 111. The median sale price for that window reached $3.8 million, up nearly $500,000 year over year, and 24 properties closed at $6 million or more, matching the combined total from the same stretch in both 2024 and 2025. East Manhattan Beach contributed the largest number of individual sales of any sub-market during those four months, which tracks with its role as the city's higher-volume, lower-entry-price zone.
The financing picture is where the pattern breaks from expectation. Citywide, the share of all-cash purchases fell to 36 percent in that January through April window, down from close to 50 percent in each of the two prior years. That's a meaningful shift toward financed buyers regaining ground, the kind of number that would normally suggest every section is getting a little easier for someone carrying a loan.
Tree Section didn't follow that trend. It posted a 48 percent all-cash share for the same period, the highest of any section in the city, even as the citywide number moved the other direction.
| Section | Typical lot | Main price driver | Cash share, Jan-Apr 2026 |
|---|---|---|---|
| Sand | About 30 to 35 feet wide, the most compact in the city | Price per square foot, driven by land scarcity and beach proximity | Not broken out separately |
| Hill | Largest of the three, capped near 15,000 square feet under city zoning | Total transaction price, driven by lot size and view | Not broken out separately |
| Tree | Mid-sized, capped near 10,800 square feet | Walkability to the Village and Mira Costa attendance | 48 percent, the highest of any section, against a citywide rate of 36 percent |
The city didn't break out Sand and Hill's individual cash shares in that reporting period, so this isn't a claim that Tree beat two known numbers. It's that Tree's number is the only one on record, and it sits well above the citywide average that includes it.
Why the Family Section Draws the Most Cash
The explanation isn't that Tree Section attracts wealthier buyers than Sand or Hill. It's that Tree Section's price floor, even at its most moderate, still sits in the high $3 million to low $4 million range for 2026 closings. That threshold filters out anyone who needs true entry-level financing long before they ever tour a listing on Oak or Poinsettia. What's left is a buyer pool heavy with local trade-up families rolling proceeds from an existing South Bay sale into the next one, plus longtime residents downsizing out of Sand or Hill who are buying their next home the same way they sold their last one, without a loan attached.
Sand Section, by contrast, draws a meaningful share of buyers purchasing a second home or a beach base outright, which produces cash activity too, but it's spread across a smaller number of total transactions on narrower lots. Hill Section's high total price naturally thins its buyer pool at any financing structure. Tree Section has more transaction volume than either, a wider buyer pool competing for a well-defined, walkable inventory, and a price point that happens to be exactly where a certain kind of all-cash move-up buyer operates most comfortably. Put a bigger pool of cash-capable buyers against a steady stream of listings on the city's most family-desirable streets, and the cash share climbs even while the citywide trend moves the other way.
Inventory hasn't loosened enough to change that dynamic yet. Active listings citywide sat at 59 as of April 30, 2026, climbed modestly to 67 by mid-August, and had eased only slightly to 62 by the start of September. That's not a supply shift large enough to dilute competition in a section where nearly half the recent buyers weren't financing at all.
What This Means If You're Financing a Tree Section Offer
None of this means a financed buyer should avoid Tree Section. It means the offer needs to be built for the actual competition, not the competition the section's reputation implies.
- Lead with a fully underwritten pre-approval, not a pre-qualification letter, so the seller's agent can't wave it off as a soft offer next to a cash bid.
- Write in appraisal gap coverage where your budget allows it. Cash offers don't carry appraisal contingencies, and that gap is often where financed offers lose on paper even when the number looks competitive.
- Move on the first two to three weekends a listing is active. Homes priced correctly for the section tend to draw their strongest response early, before a second or third price cut resets buyer psychology.
- Have your lender or advisor confirm financing timelines that match a tight closing window, since a seller weighing a financed offer against a cash one is often deciding based on certainty of close, not just price.
This is the kind of math that benefits from someone who has actually run loan files, not just read about them. Before she became a REALTOR®, Cori spent more than eight years leading a team of loan officers, which is precisely the background that makes the difference between a pre-approval letter a listing agent trusts and one they set aside.
A Few Questions Before You Write an Offer
Does a 48 percent cash share mean financing won't work in Tree Section? No. It means financing needs to be structured to compete credibly against cash, with a strong lender letter, realistic appraisal protection, and a timeline the seller can rely on.
Is Sand Section actually an easier place to finance a purchase than Tree Section? The city didn't report Sand's individual cash share for this period, so that comparison isn't answerable with the current data. What's clear is that Tree's 48 percent share sits well above the 36 percent citywide average, which is the more useful benchmark for a financed buyer.
Should I expect these numbers to hold for the rest of 2026? Cash share moves with each closing quarter and hasn't been reported section by section outside this one data window. Treat it as the clearest read available right now rather than a fixed rule, and revisit the mechanism, not just the headline price, before you shop the next quarter's listings.
If you're weighing a financed offer against a stack of cash bids in Manhattan Beach, that calculation is worth talking through before you write it, not after you lose it. Reach out to Corisandra Downing for a section-specific strategy built around how these homes are actually being bought, not just what they're listed for.